Hello! In this post we’re going to shift gear onto a new topic: Wireless Hacking! When I was younger, I loved learning about networks. I was fascinated by all of the wireless traffic floating around through the air. This lead me down the rabbit hole of wireless hacking and among the very first wireless testing tools I learned how to use was aircrack-ng.
aircrack-ng is part of a suite of tools used for various WiFi hacking methods, ranging anywhere from cracking passwords from WiFi handshakes to creating fake wireless access points. They are relatively easy to use, yet require you to have a stronger understanding of Wireless Networks than many automated scripts do. The aircrack-ng line of tools were also developed in the classic UNIX style: each does one, simple thing really well, allowing for modular and flexible attacks.
For this reason, learning how to use aircrack-ng‘s tools is a great place to start if you want to get into wireless attacks. So, without further-ado, let’s kick-off this journey by teaching you how to monitor the wireless devices in your area!
Before getting started…
I’m going to assume you have a few things you have before getting started:
- A machine running Linux (can be a VM).
- At least some experience on the command line.
- A wireless card supporting monitor mode.
If you have all those things, great! If not, then no sweat. Follow along for an interesting read and maybe get yourself all setup in the future :).
Your onboard network card may not support monitor mode (mine doesn’t) so check out this article from Null Byte on good recommendations. I have been using Panda Wireless’s PAU05 since I first started and I highly recommend getting one (or something similar) because it’s cheap and has a low profile.
Everything I’m about to teach you in this article is 100% legal. We are simply acting as observers watching traffic fly by in the air, which is public space. So, I encourage you to follow along for the best learning!
Monitor mode
By default, most network cards operate in managed mode. This just means that they will associate themselves with a single wireless access point. Currently, my wireless adapter is running in managed mode:
$ iwconfig

wlx9cefd5fee020  IEEE 802.11  ESSID:off/any
          Mode:Managed  Access Point: Not-Associated   Tx-Power=20 dBm
          Retry short  long limit:2   RTS thr:off   Fragment thr:off
          Power Management:off
Monitor mode, on the other hand, allows the wireless network card to capture traffic from other wireless access points and clients connected to those access points (or clients attempting to connect).
We can switch our wireless card into monitor mode with airmon-ng:
$ sudo airmon-ng start wlx9cefd5fee020

Found 4 processes that could cause trouble.
Kill them using 'airmon-ng check kill' before putting
the card in monitor mode, they will interfere by changing channels
and sometimes putting the interface back in managed mode

    PID Name
    644 avahi-daemon
    650 NetworkManager
    688 wpa_supplicant
    702 avahi-daemon

PHY	Interface	Driver		Chipset

phy0	wlp0s20f3	iwlwifi		Intel Corporation Ice Lake-LP PCH CNVi WiFi (rev 30)
phy1	wlx9cefd5fee020	rt2800usb	Ralink Technology, Corp. RT5372
Interface wlx9cefd5fee020mon is too long for linux so it will be renamed to the old style (wlan#) name.

		(mac80211 monitor mode vif enabled on [phy1]wlan0mon
		(mac80211 station mode vif disabled for [phy1]wlx9cefd5fee020)
You might’ve noticed that I supplied airmon-ng with the name of my wireless adapter, wlx9cefd5fee020, and it went ahead and renamed it to wlan0mon for our convenience.
Also, it identified some processes that may force our wireless card back into managed mode. You can kill those processes by running sudo airmon-ng check kill. I usually don’t because I’ve never had any trouble with this. If you’re only using an onboard wireless card, then you may want to before continuing.
Running iwconfig again, we can see that the switch was successful:
$ iwconfig

wlan0mon  IEEE 802.11  Mode:Monitor  Tx-Power=20 dBm
          Retry short  long limit:2   RTS thr:off   Fragment thr:off
          Power Management:off
Monitoring the air
Now it’s time for the fun stuff: sniffing traffic with airodump-ng!
To start it, all you have to do is give it your wireless card’s name:
$ sudo airodump-ng -M -W wlan0mon

CH  8 ][ Elapsed: 12 s ][ 2023-06-19 12:08

 BSSID              PWR  Beacons    #Data, #/s  CH   MB   ENC CIPHER  AUTH WPS      ESSI                       MANUFACTURER

 1A:F8:00:30:03:04   -1        0        0    0   2   -1                    0.0      <length:  0>               Unknown
 D8:38:FF:2C:10:28  -35        7        0    0  11  130   WPA2 CCMP   PSK  0.0      Star Legacy                Ruckus Wireless
 1C:9E:D0:DD:CA:B8  -52        7        0    0   6  130   WPA2 CCMP   PSK  2.0      Deli Customer              eero inc.
 1E:9D:F6:D7:CA:BE  -53        7        0    0   6  130   OPN              0.0      MyCoolWiFi                 TP-Link Corporation Limited
All you need to start airodump-ng is to run airodump-ng <card name> but I like to add -M to display manufacturer info and -W to see what version of WPS the access point (AP) is running.
airodump-ng neatly separates data into columns, including:
- BSSID: The device’s MAC address
- PWR: The wireless signal strength (the larger the number the closer the AP)
- CH: The frequency channel the AP is operating on
- ENC: The encryption method being used (if any)
- and more!
Additionally, airodump-ng lists clients associated with an AP. We can zero in on a single AP to view the devices connected to it:
$ sudo airodump-ng --bssid 11:F5:20:FF:C4:83 -c 6 wlan0mon

 CH  6 ][ Elapsed: 6 s ][ 2023-06-19 13:01

 BSSID              PWR RXQ  Beacons    #Data, #/s  CH   MB   ENC CIPHER  AUTH ESSID

 11:F5:20:FF:C4:83   -1   0        0        0    0  -1   -1                    Batman

 BSSID              STATION            PWR   Rate    Lost    Frames  Notes  Probes

 11:F5:20:FF:C4:83  EA:C8:FE:DC:63:46  -60    0 -12      0       83
 11:F5:20:FF:C4:83  CA:98:CB:4C:93:1A  -62    0 -12     15       54
 11:F5:20:FF:C4:83  92:D0:69:4F:F6:D3  -78    0 -12      0        1
Now, we can see all of the client MAC addresses that are connected to the “Batman” under the STATION column.
Monitoring a single network in this way can allow you to leverage a surprising amount of information. For example, you can see what devices are connected to a network, giving you a rough idea of its structure and purpose. You can even get an idea of how many people are in a building given the number of mobile devices connected.
There are more ways we can filter down all of this information. I highly recommend checking out airodump-ng‘s manual page with man airodump-ng to see what else you can do.
Visualizing Results
If you are capturing a ton of traffic, it can be extremely helpful to save the output to a file for examining and processing later. For example, I collected information about the networks near me on all bands (both 2.4 and 5 GHz) and saved the output to a file with this command:
$ sudo airodump-ng -b abg -w /tmp/capture/blog-test wlan0monThe -b argument tells airodump-ng what bands to hop across (in this case, all) and -w tells it the file name/location to write to.
airodump-ng writes the data to a number of different file formats, including a csv (which can be useful for opening as a spreadsheet or using in a script), and files that can be passed to other tools (like kismet, wireshark, or aircrack-ng).
It can also be helpful to make this large amount of information more visual. This can be easily done with airgraph-ng. Note, airgraph-ng didn’t come installed with the rest of the aircrack-ng tools when I installed it, so you might have to install it separately.
To run airgraph-ng you feed it the csv file written by airodump-ng and specify a graph type:
$ airgraph-ng -i blog-test-01.csv -g CAPR -o blog-test-capr.pngWe supply a graph-type of CAPR with -g. CAPR stands for Client to AP Relationship and is useful for quickly seeing what AP’s are nearby and what devices are connected to them. Here’s a snippet of the one I took of the networks in my area:
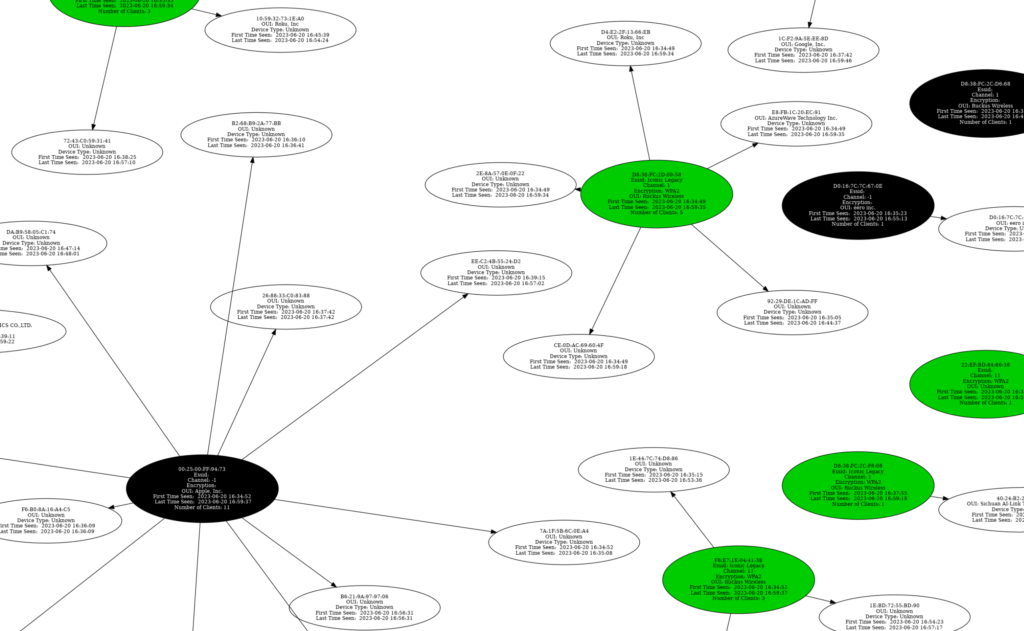
This is much easier to wrap our head around (at least for me) than scanning rows in a spreadsheet. The colored ovals represent the security encryption of the AP.
The other graph type, CPG, stands for common probe graph. It’s shows us the devices that are sending probe requests (trying to connect) to certain AP’s. To generate your own, change the -g option from the last command to CPG and you should get something like this:
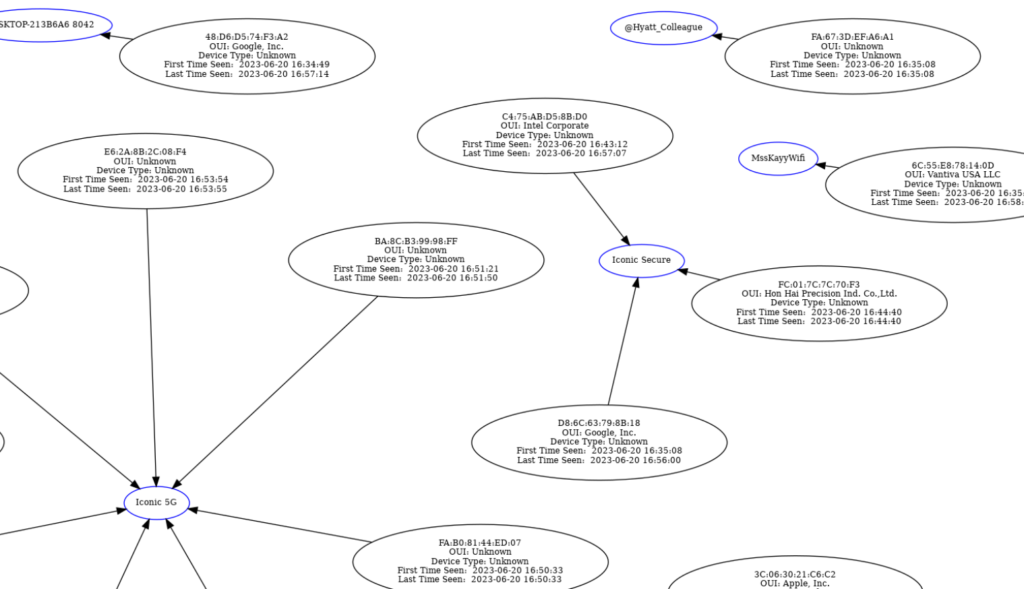
It’s a lot less colorful than the CAPR, but can be useful for nefarious acts, such as creating a fake AP for these clients to connect to.
Exiting Monitor Mode
After we’ve finished monitoring networks, it’s time to revert our network card to manged-mode so it can connect to WiFi again. airmon-ng makes this a snap:
$ sudo airmon-ng stop wlan0monIf you had airmon-ng kill any services, you may want to restart them like so:
$ sudo systemctl NetworkManager startIn the case you didn’t remember which services you killed fret not! A simple reboot of your machine will get the services back up and running.
Conclusion
Now you know how to observe the access points around you! This is a powerful skill that can be used to develop attacks — knowledge is power!
I encourage you to be curious and try this at your home or anywhere you might find yourself. It’s good practice to familiarize yourself with how different wireless networks behave. Just make sure you hide your screen in public. Don’t want to scare anyone with your flashy hacker terminal!
In the coming future, we’ll go more in-depth into monitoring wireless networks so stay tuned! In the meantime…have fun!